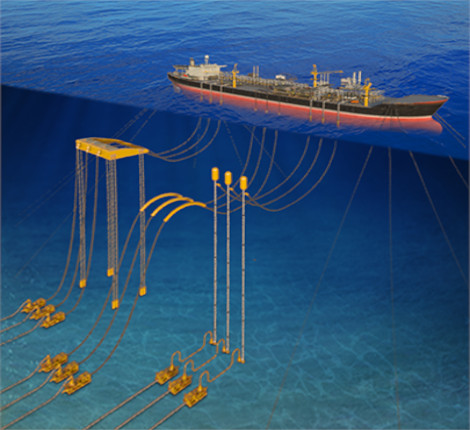
4 Platforms & Floaters ASSESSMENT & Comparison
The following chapter will attempt to compare the main functions, characteristics, strength & weakness of the different floater concepts available for the deepwater (>500m) and ultra-deepwater (>1500m) fields developments.
4.1 Main Functions Comparison
Platforms and Floaters main function capabilities are compared in the following Table:
Table 4.1 - Floaters Functions Comparison
EDP(7) | FPSO (6) | Semi-Submersible | |||||
Dry Trees | Yes | Yes | Yes | No | Yes | Possible (5) | No |
Production | Yes | Yes | Yes | Yes | Yes | Yes | Yes |
Storage | No | Yes (8) | No | Yes | No | Yes (8) | Yes |
Drilling | Yes | Yes | Yes | Yes (1) | Yes | Possible (5) | No |
Workover | Yes | Yes | Yes | Yes (1) | Yes | Possible (5) | No |
SCRs utilisation | n/a | Yes | Yes | Possible(2) | Yes | Possible(2) | Possible(4) |
Max. Oil Production (3) | 280 kBPD | 160 kBPD+ | 200 kBPD | 330 kBPD | 370 kBPD | 360 kBPD | 120 kBPD+ |
Water Depth Limitation | 500m | 3000m+ | 3000m+ | 3000m | 1500m | 2500m | 1500m |
Notes
Drilling FPSO (FDPSO) for mild environmental conditions (West of Africa) : AZURITE FDPSO (Tullow, Congo).
Depending on water depth & environmental conditions, or long lazy wave SCR to be considered.
kBPD = 1000 Barrels Per Day.
Under investigation in GOM
Qualified for DDSS
Concept still under development
Limited storage capacity
4.2 Main Characteristics Comparison
The following Tables aim to summarise and compare the main characteristics of deepwater production concepts.
Table 4.2 - Platforms & Floaters Main Characteristics
Concept | Main Characteristics |
Compliant Tower
|
|
SPAR
|
|
| |
| |
Concept | Main Characteristics |
Semi-Submersible
|
|
SSP
|
|
|

4.3 Platforms & Floaters Motions Comparison
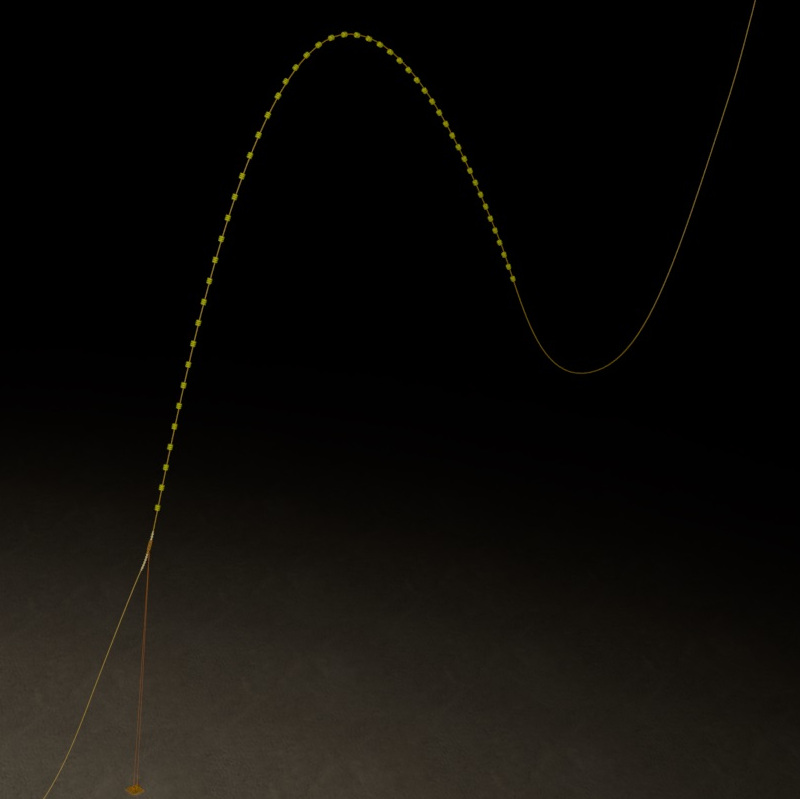
Wave motions of floaters induce different loads and fatigue to their associated mooring and riser systems of which heave motion is a main design criteria. The following Figure presents the relative heave motion versus the wave period of the main floater concepts for deepwater application.
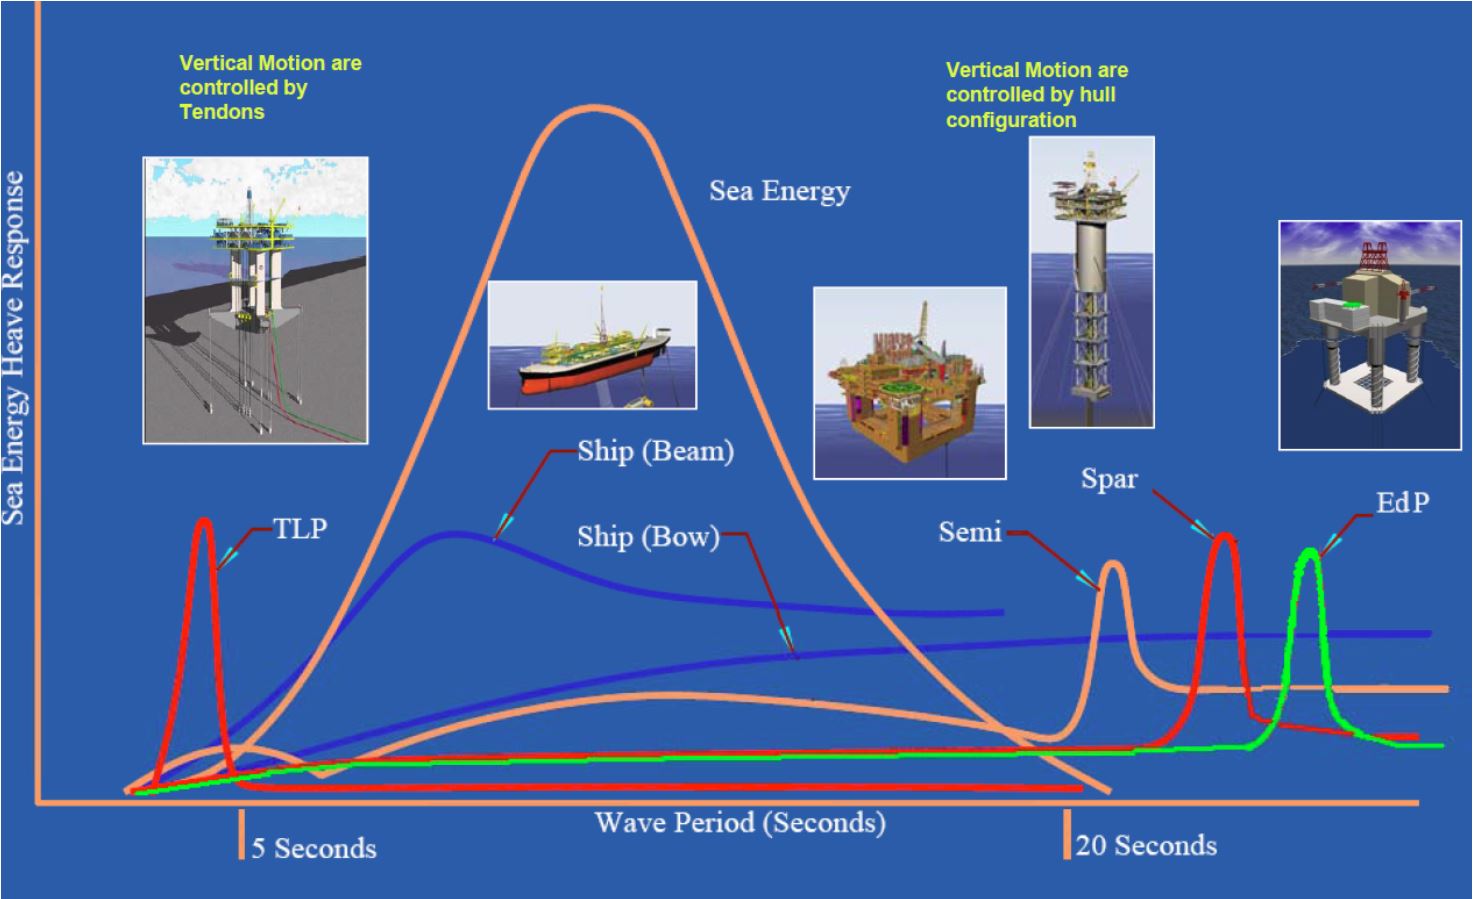
The following values present typical motions amplitudes for SPAR and TLP in the Gulf of Mexico environmental conditions:
SPAR
Heave:
0.5 feet (0.15m) Annual Winter Storm.
12 feet (3.6m) 100 year Hurricane.
Pitch:
0.5° mean plus 1.5° dynamic in Annual Winter Storm.
5° mean plus 5° dynamic in 100 year Hurricane.
Surge:
6% of Water Depth below Keel in 100 year Hurricane.
Heave: - Max. 1 foot.
Pitch: - Zero.
Surge: - 10% of Water Depth.
4.4 Platforms & Floaters Strengths & Weaknesses
The following section summarise the main perceived strengths and weaknesses of the different floater concepts:
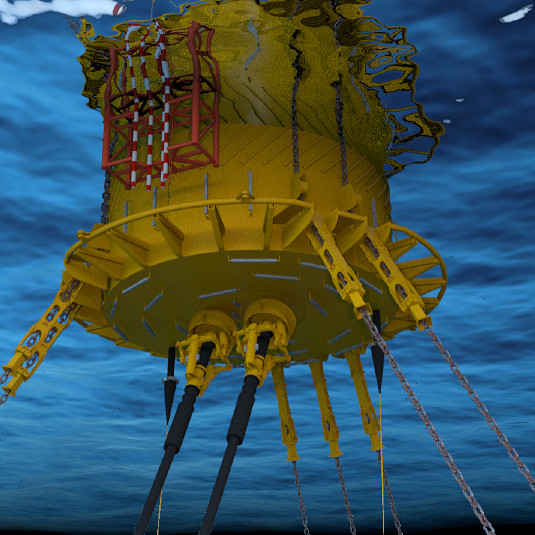
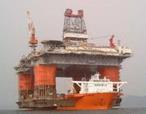
SPAR (Traditional market: deepwater & ultra-deepwater dry tree facilities and high payload).
Strengths:
Dry trees.
Good platform for drilling.
Low cost for additional payload.
Excellent stability (e.g. GoM hurricanes).
Well suited to ultra deep waters
Weaknesses:
Offshore topsides installation/integration necessary.
High initial ‘capex’ costs (fabrication and installation).
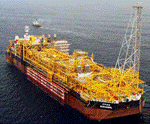
FPSO (Traditional market: offshore oil storage requirement and wet trees).
Strengths:
Storage areas with no/little infrastructure.
Flexible - defined by storage requirements rather than payload.
Traditionally considered to be cheaper than other floater concepts.
First choice for wet tree-type developments, e.g. subsea completion.
Weaknesses:
No dry trees.
Cannot use SCRs except in exceptionally benign conditions, e.g. West of Africa.
Integration/interfaces complex.
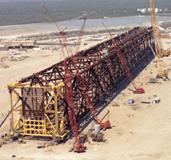
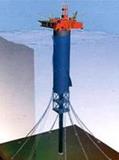
TLP (Traditional market: deepwater dry tree facilities).
Strengths:
Dry Trees.
Proven solution for deepwater (<1500m).
Riser system simple.
Weaknesses:
Typically more expensive in deeper water.
Coupled design - involved design spiral, e.g. payload, hull size, tendon size, etc.
High degree of complexity in design and fabrication.
Drilling systems can have high downtime.
Unstable if one tendon fail.
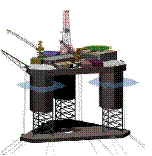
Semi-Submersible (Traditional market: multiple purposes drilling, production although not combined with dry trees).
Strengths:
Proven solution.
Less steel required for given payload.
Large deck space.
Topside integration at quayside or by float over.
Weaknesses:
High initial ‘capex’ costs (fewer tons are not necessarily cheaper tons).
Traditional viewpoint is that motions are too high for use of SCRs, e.g. lazy wave SCR required.
Extended Draft Platform (Potential market: deepwater dry or wet tree facilities in remote areas with marginal onshore facilities, good local content).
Strengths:
Quayside topsides integration.
Dry trees.
Large deck space.
Good platform for drilling.
Low cost for additional payload.
Weaknesses:
New design not field proven.
High initial ‘capex’ costs.
4.5 Floaters Selection Criteria
The selection of the floater concept will depend greatly on the selected Field Architecture (Ref.) which is the result of analyses on key issues and technical topics, as follows (but not limited to):
Economics (tax regime, financing, production sharing agreement, etc).
Field size, reservoir geometry, number of wells.
Process requirement (capacity, nature of treatment).
Oil storage requirement, oil & gas export strategies (shuttle tanker, subsea pipelines).
Water Depth.
Development strategy (fast-track, phased development).
Regional context (local content, access to support services, export infrastructure).
Political risk.
Experience/preference.
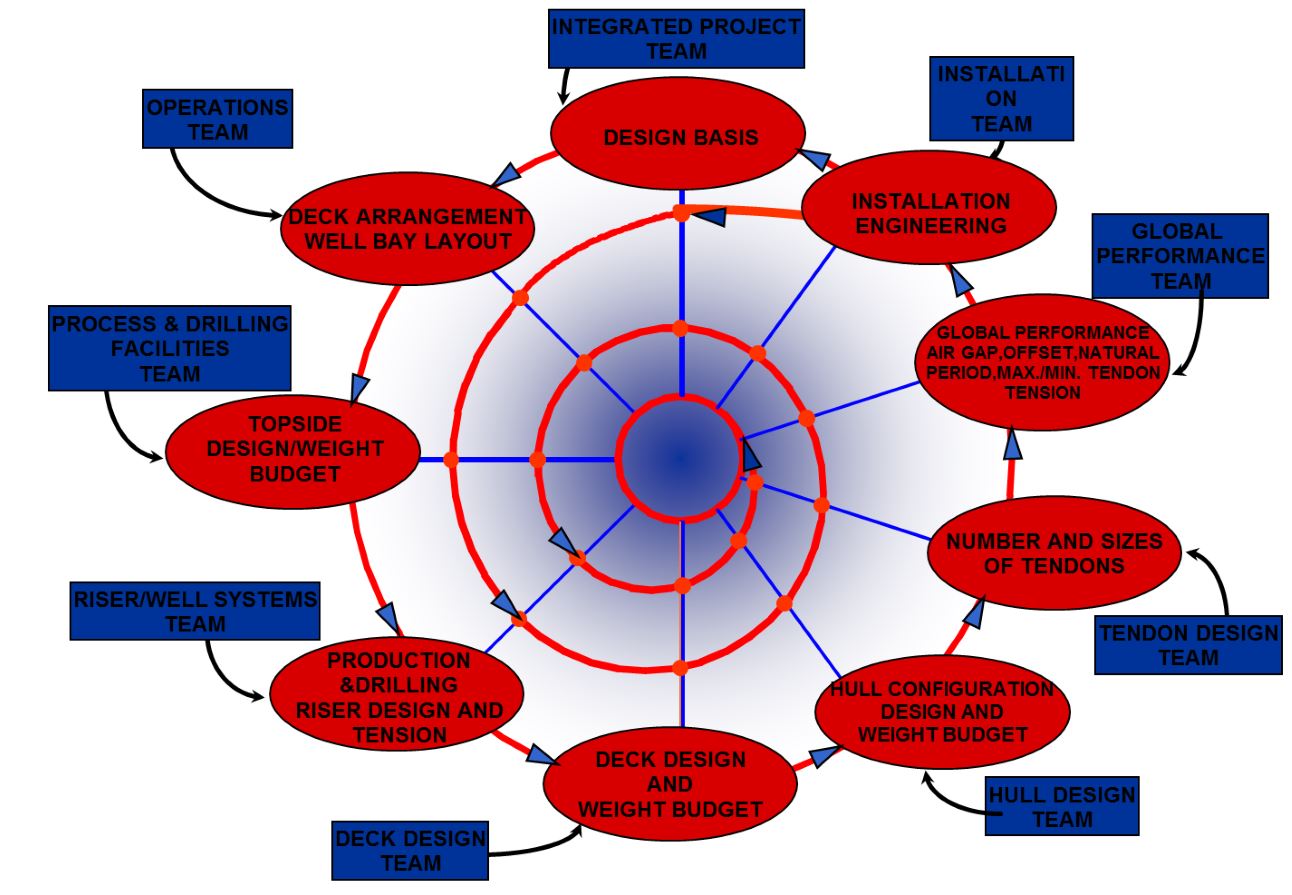
4.6 Design Cycle & Concept Selection
The picture below shows a TLP design cycle, which is a typical engineering process applicable to the design of most floater concept with following variations:
4.7 Platforms & Floaters Water Depths & Productions Comparisons
The following Figures summarise the current status and the future potential of Deepwater Production Concepts based on three key topics:
WaterDepthRange, Figure 4.4, “Water Depth Range Comparison by Deepwater Production Type (by Courtesy of Offshore Mag.)”.
Production Capacity Mboe/d (million barrels oil equivalent per day), Figure 4.5, “Throughput Capacity Ranges by Deepwater Production Type (by Courtesy of Offshore Mag.)”.
Well Capability, Figure 4.6, “Well Capability by Deepwater Production Type - Includes Production & Water Injection Wells (by Courtesy of Offshore Mag.)”.
Figure 4.4 - Water Depth Range Comparison by Deepwater Production Type (by Courtesy of Offshore Mag.)
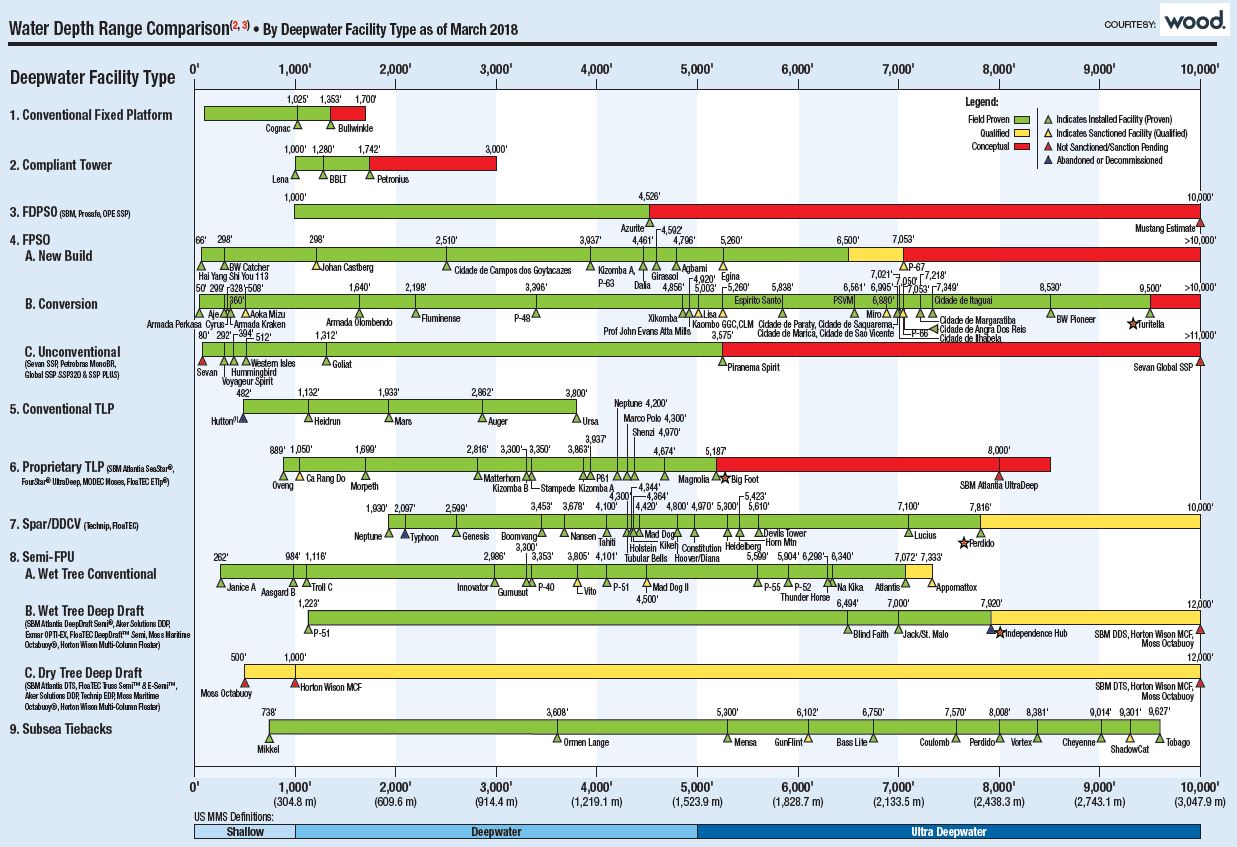
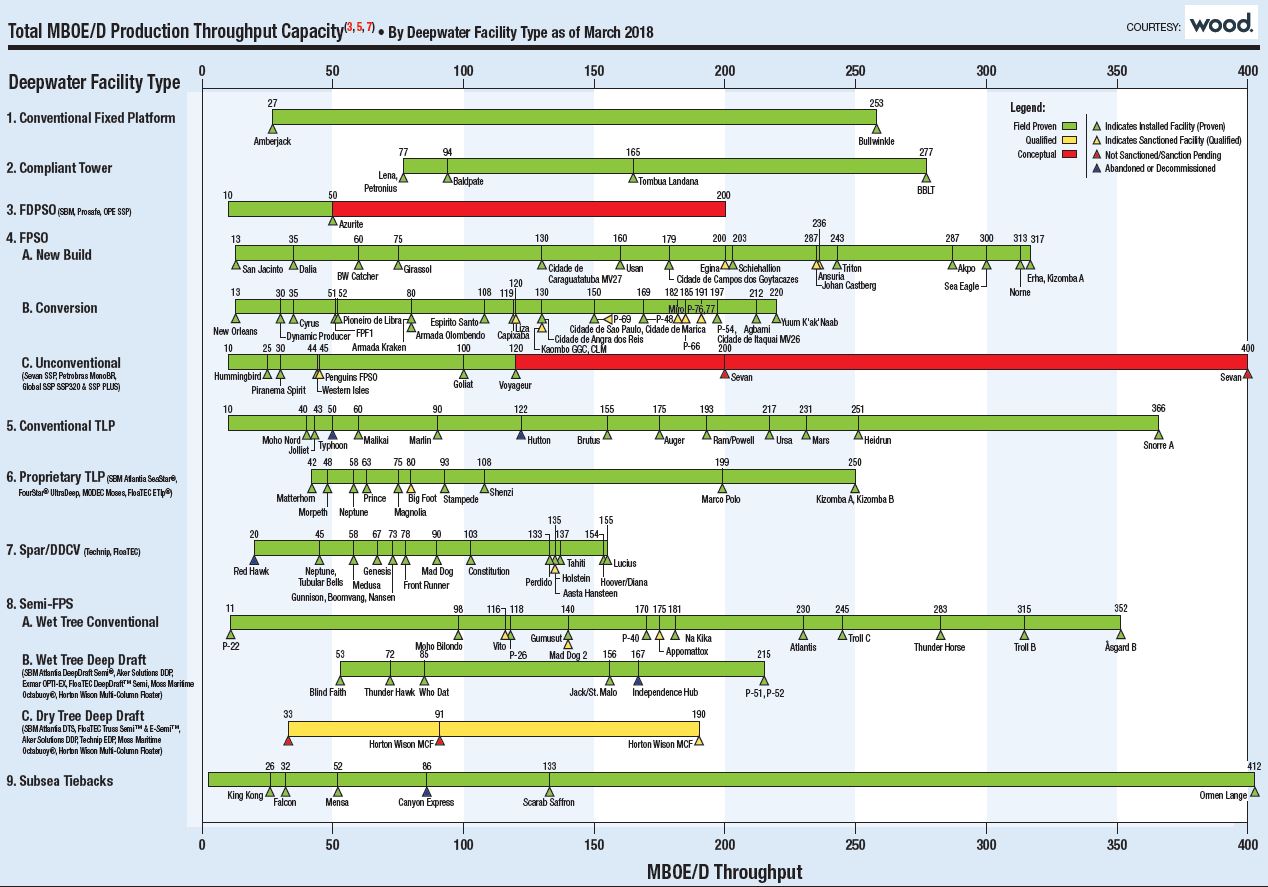
Figure 4.6 - Well Capability by Deepwater Production Type - Includes Production & Water Injection Wells (by Courtesy of Offshore Mag.)